Diesen Artikel auf Deutsch lesen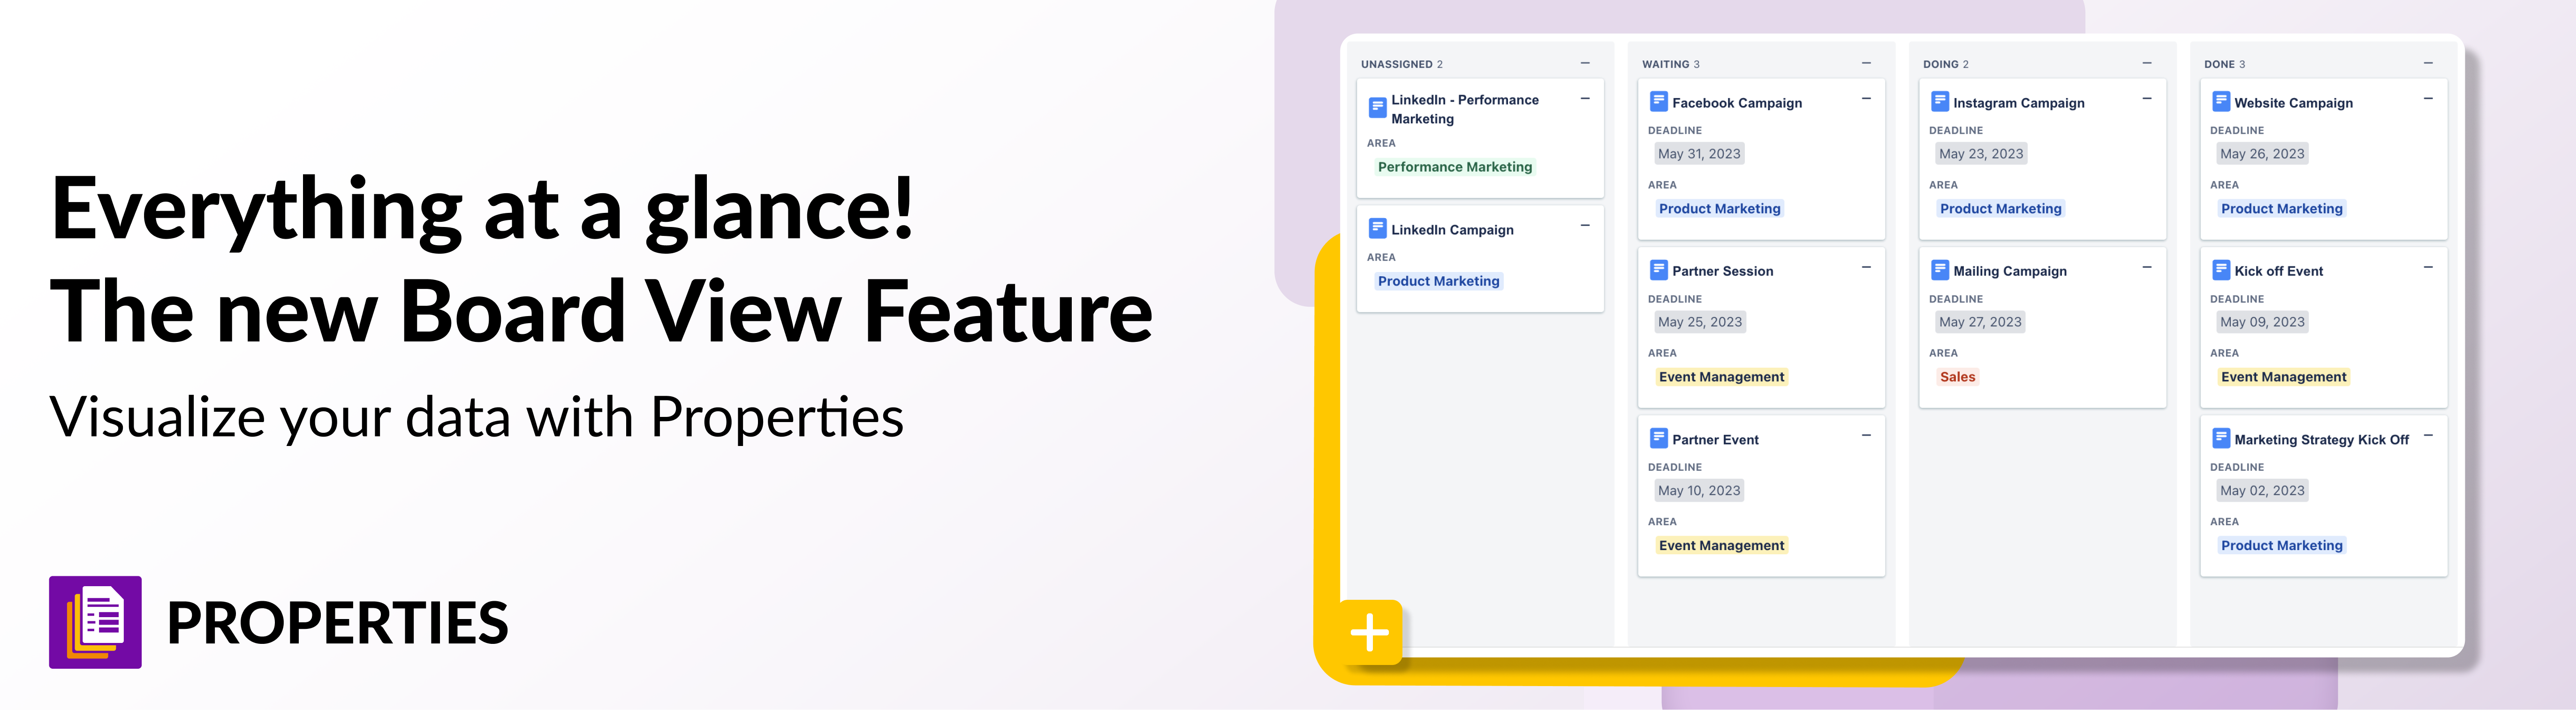
For the history buffs out there, the foundation for the modern-day GUI (Graphical User Interface) was developed at the Xerox Palo Research Center (parc) in the late 1970s. The ability to visualize information and interact with data via “drag and drop” versus the traditional method of keystrokes and lines of code was a revolution in computing.
Prior to the GUI, in the 1940s, Taiichi Ohno introduced kanban boards at Toyota. Considered the “father” of the Toyota Production System, Ohno’s Kanban methodology inspired lean manufacturing in the United States. Fast forward to the present day, we are still discovering opportunities where the visualization of data can be enhanced to improve not only the user’s experience but also the efficiency and power of that information as a direct result.
Visualize Your Data With Properties
Speaking of Kanban boards, the developers at Junovi have once again added a powerful, intuitive feature to their Properties app. With the Property Group Visualization macro, you can create either an OrgChart or Board View. The Board View gives you the ease and functionality of, you guessed it, a Kanban board.
To understand how this is possible, let me first explain what Properties actually is. Properties is a Confluence app allowing users to create their own tables (in Confluence, known as properties). These tables are then filled customised fields allowing users to capture everything from due dates, task owners, related pages, and practically anything you’d need and then be embedded these properties into your Confluence pages and templates.
With the new Property Group Visualization macro, not only can you capture data, report, and filter, but you can also create charts and visualizations of your data, then drill down into that data, manipulate and rearrange it. You can access the Board view with the Property Group Visualization macro via the “+” menu option within a Confluence page.
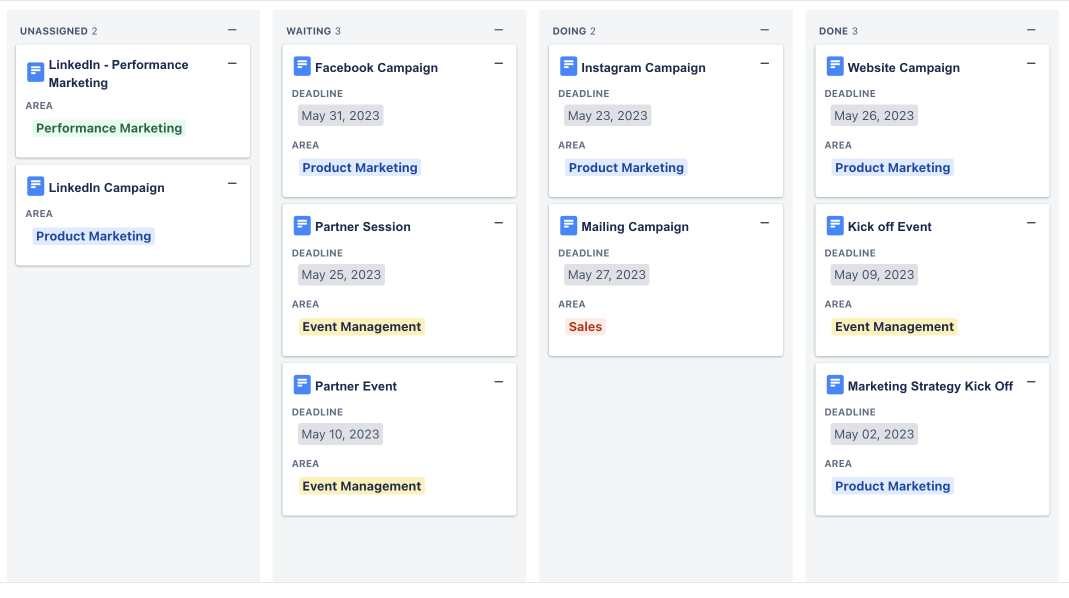
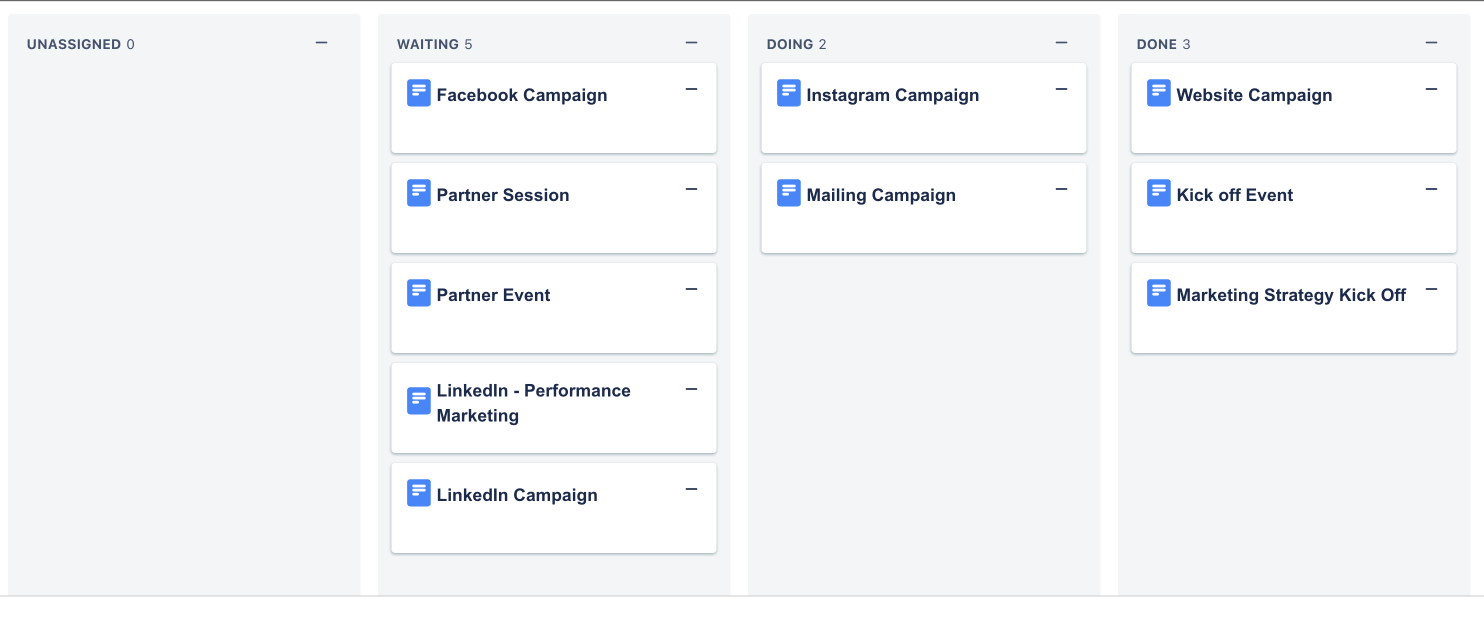
There are a number of benefits to this new visualization right out of the gate, including the ability to manage the progress of pages, projects, or metadata in Confluence and organize it in columns based for example on status or another property you’ve created. Rather than scrolling through or reordering a table view, you can now use the “drag and drop” functionality and structure of a Kanban board to update information. This allows for a much-improved overview of your data and greater transparency.
 Drag And Drop Your Way On Over

We can see the gears turning in your mind already. You want to put Properties to work for you and your organization’s information. The best way to find out what it can do for you is to give it a try. Head over to the Atlassian Marketplace and install Properties - Templates, Metadata & Databases. We’re certain you’ll be glad you did!
Further Reading
- Properties Takes Org Charts To A New Level in Confluence
- Properties for Confluence – a Lifesaver in Asset Management and Business Organisation
- How to Organize Onboarding Documents in Confluence Cloud with Properties
- How To get More Insights To Your Projects In Confluence Cloud with Properties
- How Properties Help Organize Your Team’s Information


