Agile Hive - SAFe® with Atlassian Tools
available as of December at the Atlassian Marketplace
Agile software development presents many companies with great challenges: Teams may be working in an agile system while management often still takes a more classic approach. So how do you manage to switch to a more agile way of working?
The "Scaled Agile Framework for Lean Enterprises" (SAFe®) helps you control the different areas associated with software development: Portfolio, Solution, Program, and Team.
You can also create more transparency while balancing between business strategy and execution. Another benefit is that you can achieve better quality results along with increased predictability.
Agile Hive is a well established SAFe® solution which is based on the Atlassian tools, Confluence and Jira, that a lot of companies are already familiar with.
Jira is no longer exclusively used in software development: different areas of your organization as well as a variety of different companies can all benefit from using Jira. The tool gives you numerous possibilities to work with. For example, you can use it as an operational project management tool or even just for simple task management. Due to its constant development, Jira is being designed for use in many different applications. Working with Confluence and Jira gives companies more ways to collaborate, it assists with knowledge management and organization combined with both project and simple task management.
Agile Hive uses these tools so that it can work with the SAFe® method, thereby using its well known and established processes that are already integrated into most company workflows.
Until now, Agile Hive was a collection of different Apps from different providers, but over time it has increasingly developed into a holistic solution.
A lot has happened in recent weeks. Coming up in December, Agile Hive will be published for the first time as a complete solution in the Atlassian Marketplace. In the following article we're going to give you a sneak peak at what we've been working on.
Redesign
We've given Agile Hive quite the overhaul: we've made the introduction, useability, and maintenance all much more user-friendly.
Before, Agile Hive used to consist of 13 different extensions. In this new version we've made it available as an app on the Atlassian Marketplace. It's less than a month away to this first release and it includes the following highlights:
-
-
- Project Hierarchies - visual editor to creating hierarchically organized project structures in Jira
- Context - automatically display parent-child relationships hierarchically within operations
- Team / Program Reports - automatically generate reports for projects on the SAFe® levels team and program
-
In this article we'll discuss these three highlights in more detail. Of course, you can still use the classic extensions like before, such as Structure or AutoPage. These extensions are still fully compatible and will remain so.
The upcoming releases of the Agile Hive app will focus on developing new features in order to map existing features from the numerous classic extensions and to integrate them directly.
Project Hierarchies
What are Project Hierarchies?
This new approach to Agile hive is based on "Project Hierarchies". With Project Hierarchies, Jira projects (displayed as colored nodes) can be set in hierarchical relationships (displayed as gray connection lines). These relationships ensure that only tasks within these projects can be linked hierarchically, and only as the respective relationships between the projects allow.
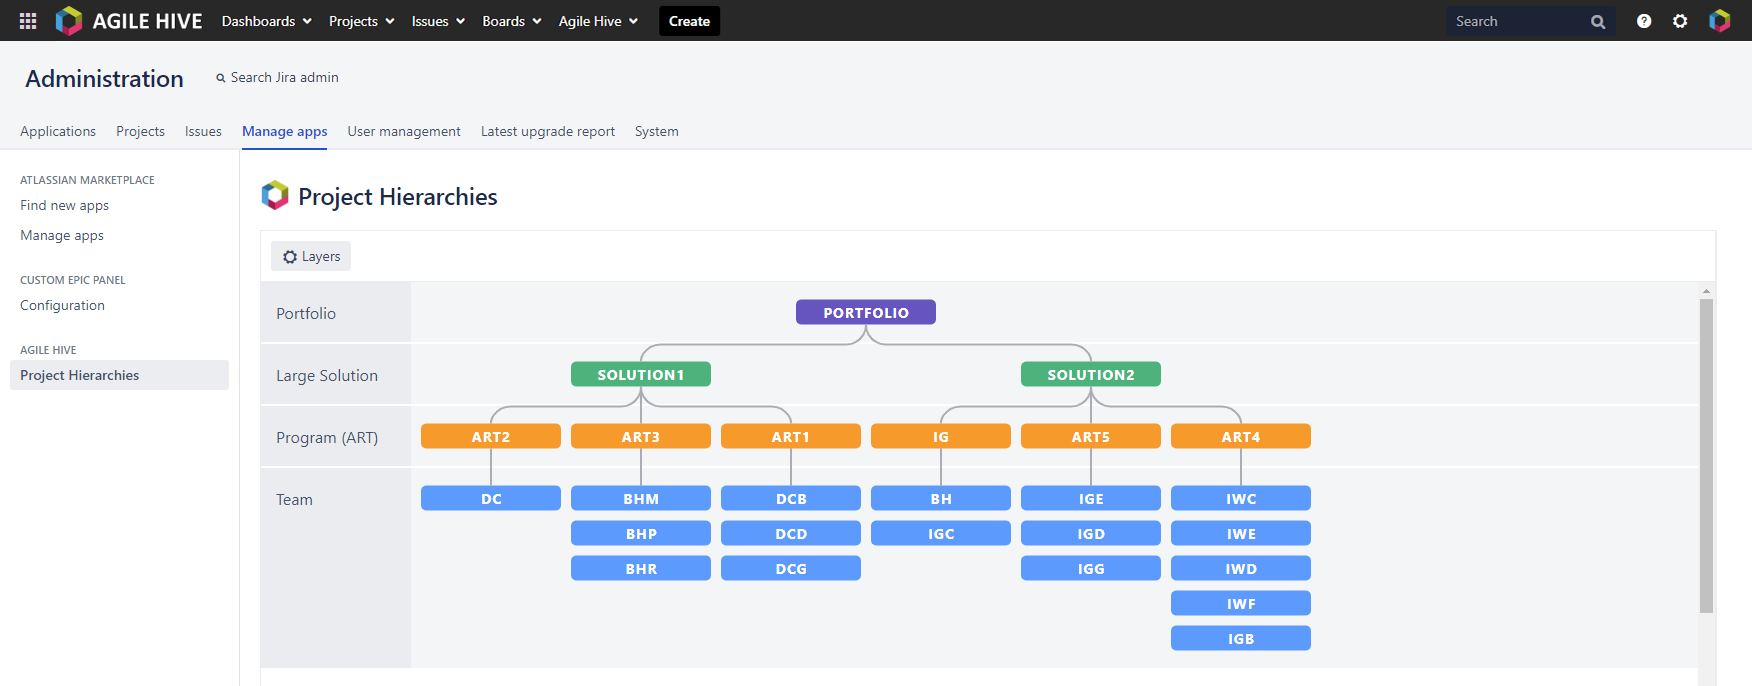
Project Hierarchies ensure correct hierarchical relationships between tasks.
Examples:
-
-
- A task in the project "DC" can only be linked hierarchically with a task from the project "ART2".
- A task in the project "ART2" can be linked hierarchically with a task from the project "DC", but also with a task from the project "SOLUTION1".
-
In principle, each process can only be linked hierarchically with a "parent process". You can link a "father process" hierarchically with any number of "child processes".
What does "hierarchically linked" mean?
In principle, Jira processes can be linked to all existing "general" link types, such as "relates to" or "is blocked by". Here with Agile Hive we've introduced a new link type: the options for this link type are "parent of" and "child of". These two options are used for "hierarchical linking", but, as mentioned above, they can only be set in the valid case. You can still set all other "general" link types independently of the hierarchy.
Project Hierarchies - a new project structure that introduces the link types "parent of" and "child of".
How do I create Project Hierarchies?
You can create Project Hierarchies in these three simple steps:
-
-
- As the Jira Administrator, you can create any number of layers in the visual editor. Don't forget to give them titles and add colors.
- These layers can then be assigned to the desired Jira projects.
- Finally, you can assign the relationships of the projects to one another.
-
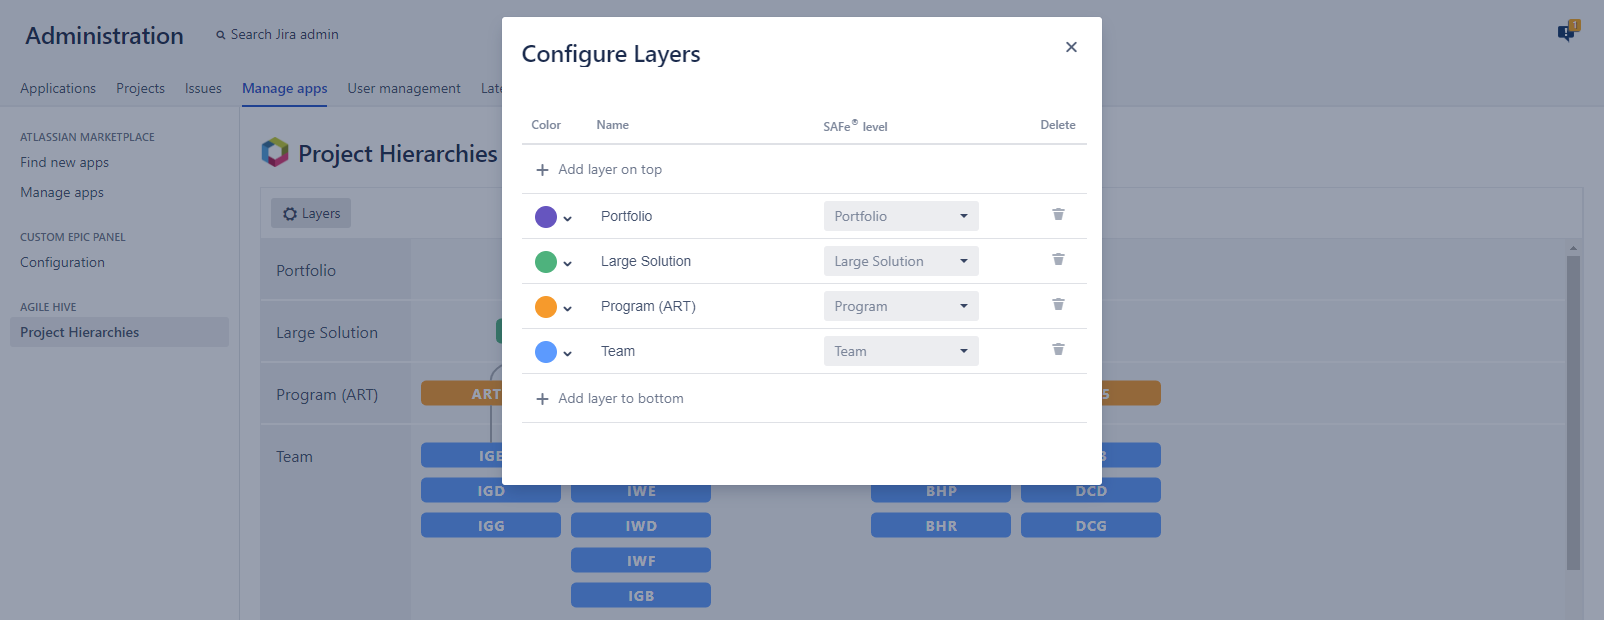
Configure the layers that form a project hierarchy.
Context View (visualizing parent-child relationships)
What is the Context View?
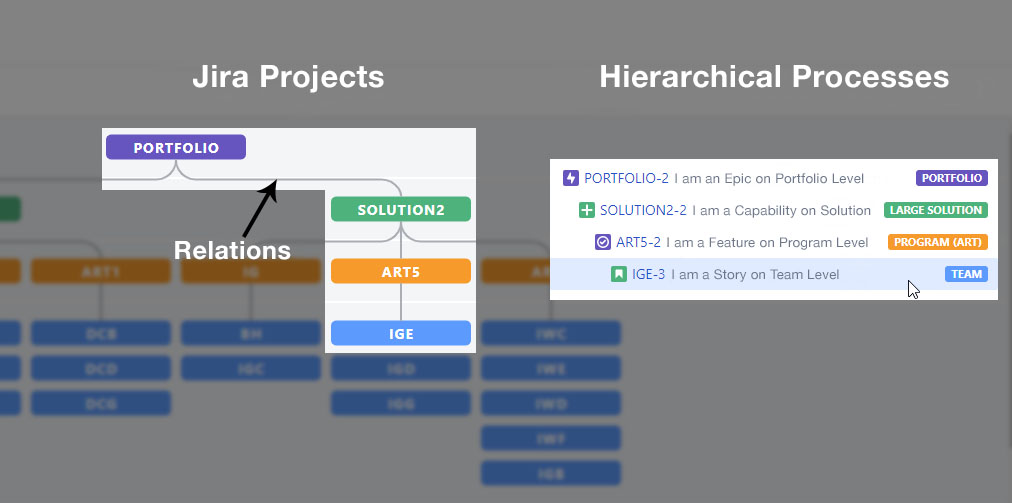
The "Context View" takes the operation you have opened and displays it in a hierarchical fashion. Additionally, it also displays the layer name and color. You can clearly see the context of the respective process - hence its name.
When can I see this view?
When you have a project that is stored in "Project Hierarchies", that project's tasks automatically represent the relationships they have to their parent tasks in the "Context" tab. You don't even need to reconfigure anything, it's that simple.
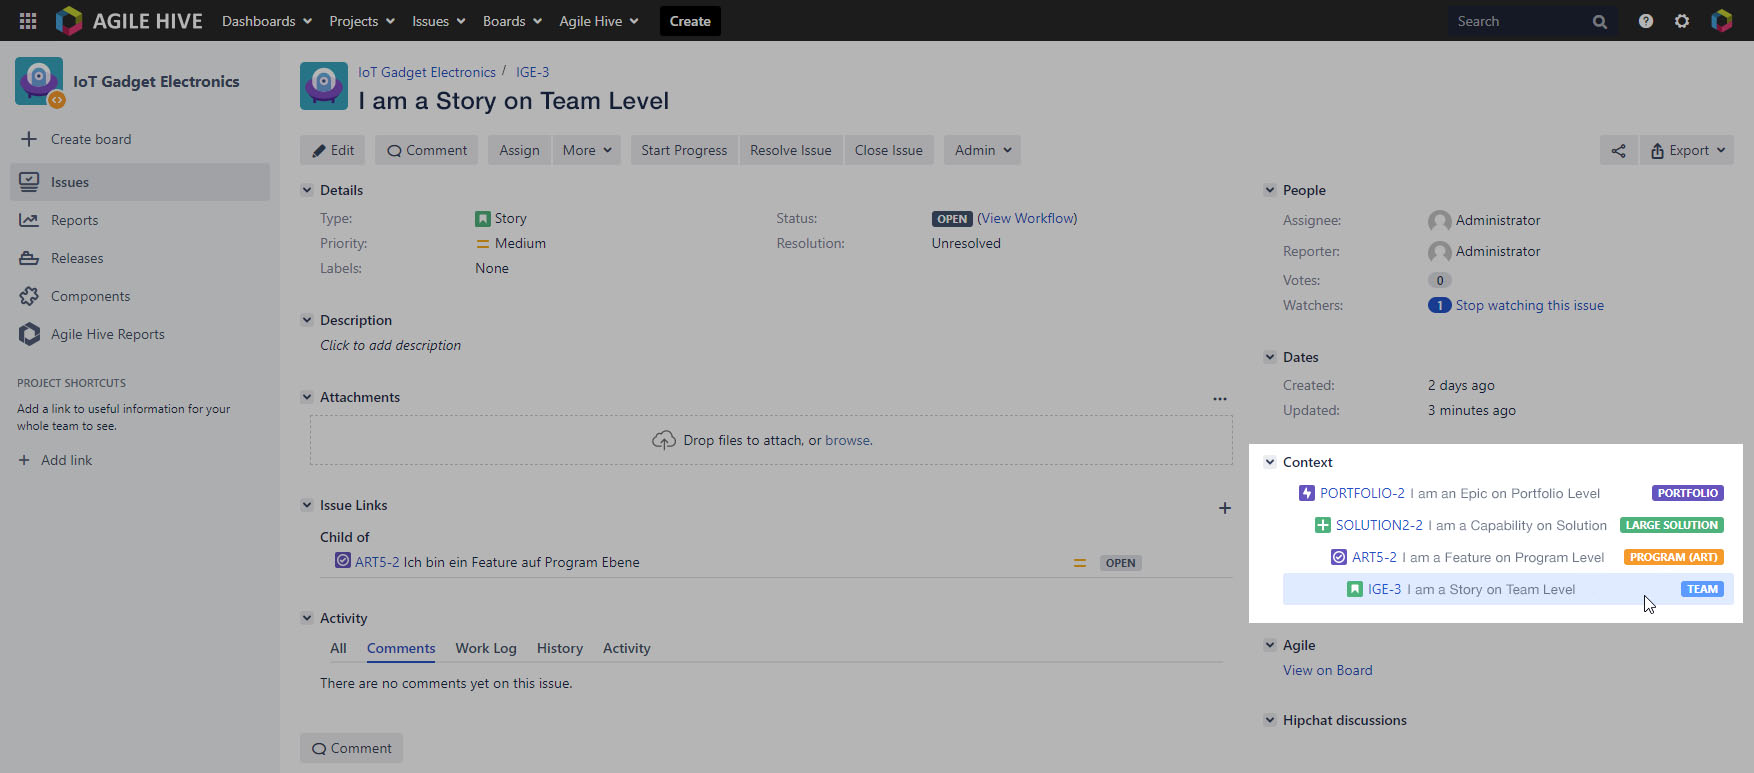
"Context View" shows users at first glance the "father processes" of opened processes hierarchically.
Team Reports
What are Team Reports?
Team reports represent relevant team metrics. This is done in the form of tiles in a single overview, according to SAFe's specifications. Each team has an automatically generated view, maintained with real-time data, for each of their respective team projects.
You can select the Program Increment (PI) to be viewed via a drop-down menu. This allows you to view historical data from past PIs, for example. No configuration is required to view PIs.
Next, we'll explain the different metrics that are set to be released bit by bit in the coming months.
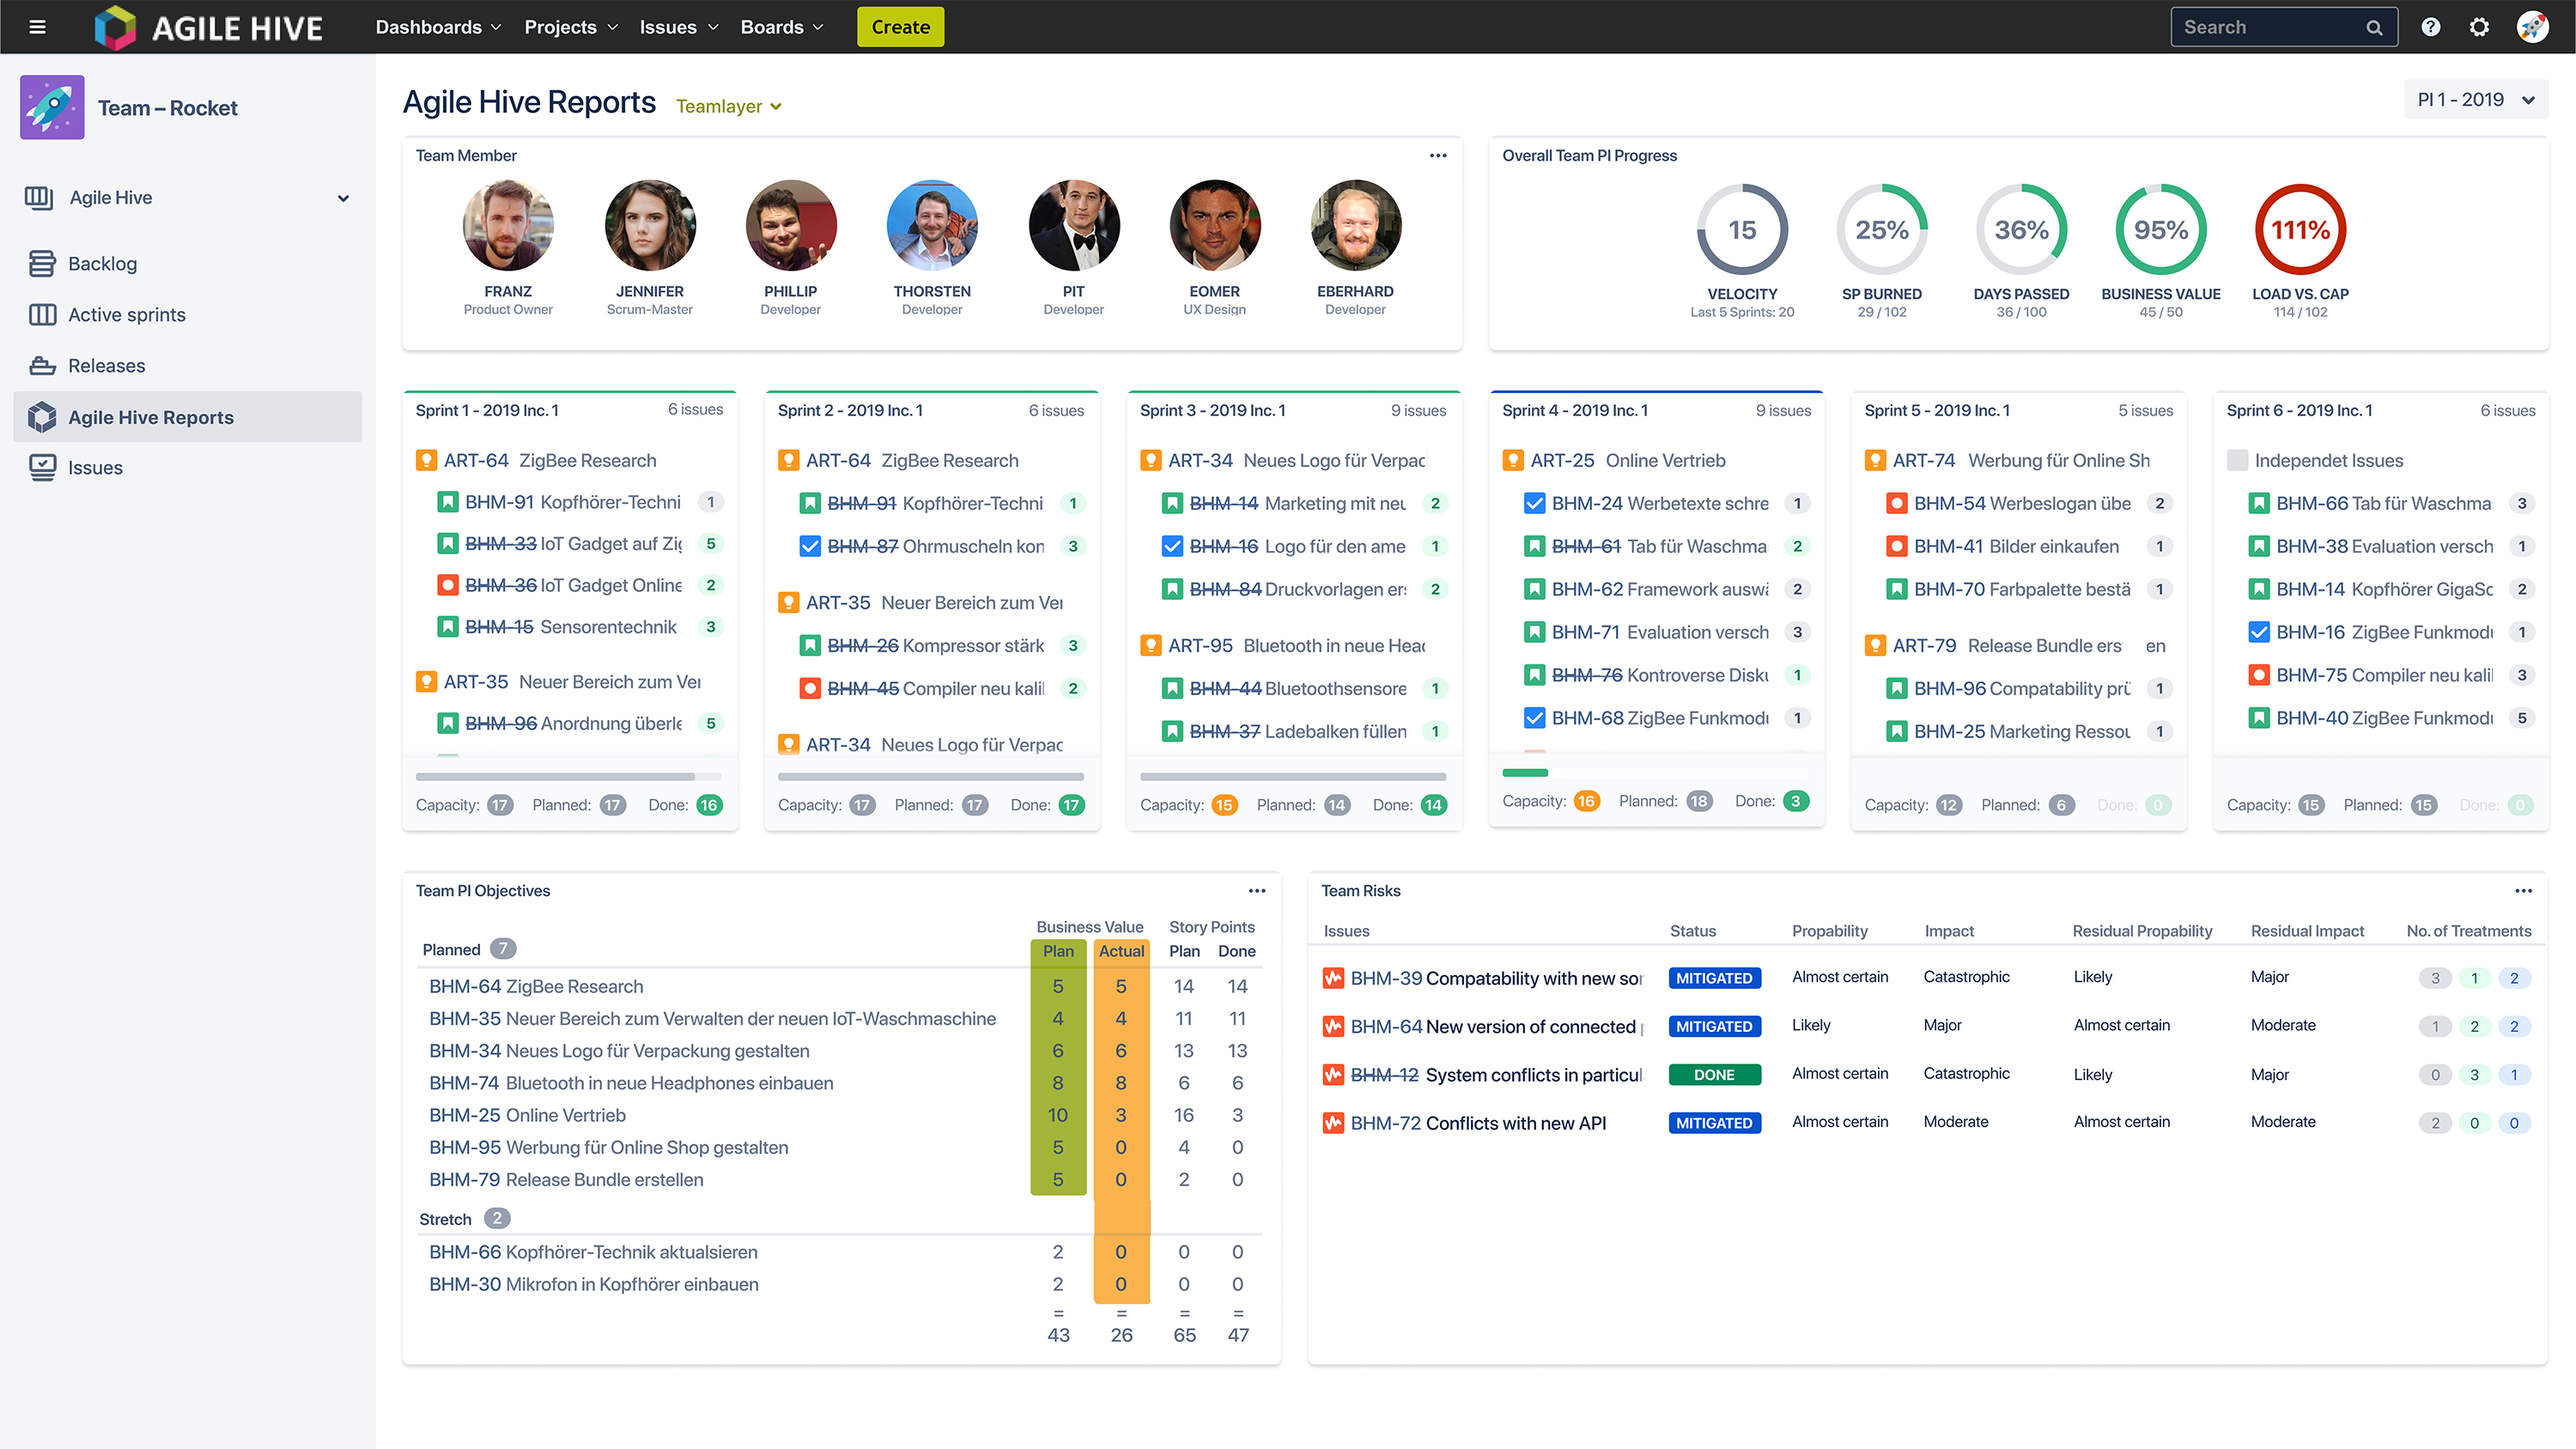
A look ahead: Here's a sneak peak at what the fully developed version of Team Reports will look like with our upcoming releases.
Team Member
This is a representation of all individual team members. Team members each have a display including an avatar, first name, and role so that contact people can be identified more quickly.
Overall Team PI Progress
Included are five important (partially aggregated) key figures to view progress, performance, and planning at a glance:
-
-
- Velocity - Compares the current velocity (inside the circle) with the velocity of the last 5 sprints.
- SP Burned - Total progress across all burned Story Points (SP) of the team within a PI.
- Days Passed - Compares number of total days with days still available.
- Business Value - Point total based on the business value derived from the team's PI Objectives.
- Load vs. Cap - Compares planned Story Points with available capacity.
-
Sprints (included in first release)
This displays all of a team's planned (grey), active (blue), or competed (green) sprints. The contents of the sprints, including the "father processes", are displayed in the program level.
The overview will also include a progress bar, key figure capacity, planned story points, and completed story points.
Team PI Objectives
The defined "Team PI Objectives" are presented strictly according to SAFe guidelines. Additionally, this tab shows the story points that are associated with the processes that contribute to their respective "Team PI Objectives".
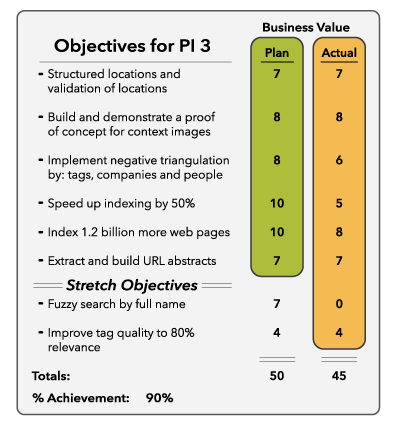
Team PI Objectives according to SAFe-guidelines
Teams Risks
This displays risk management according to ROAM (Resolved, Owned, Accepted, Mitigated) including listing all risks associated with a given team. The classification is based on probability and impact. "Treatments" are procedures where you deal with the respective risks. Along with their status, these treatments are displayed with each risk. Additionally, treatments have a direct effect on how likely something is to happen (residual probability) and impact (residual impact).
Program Reports
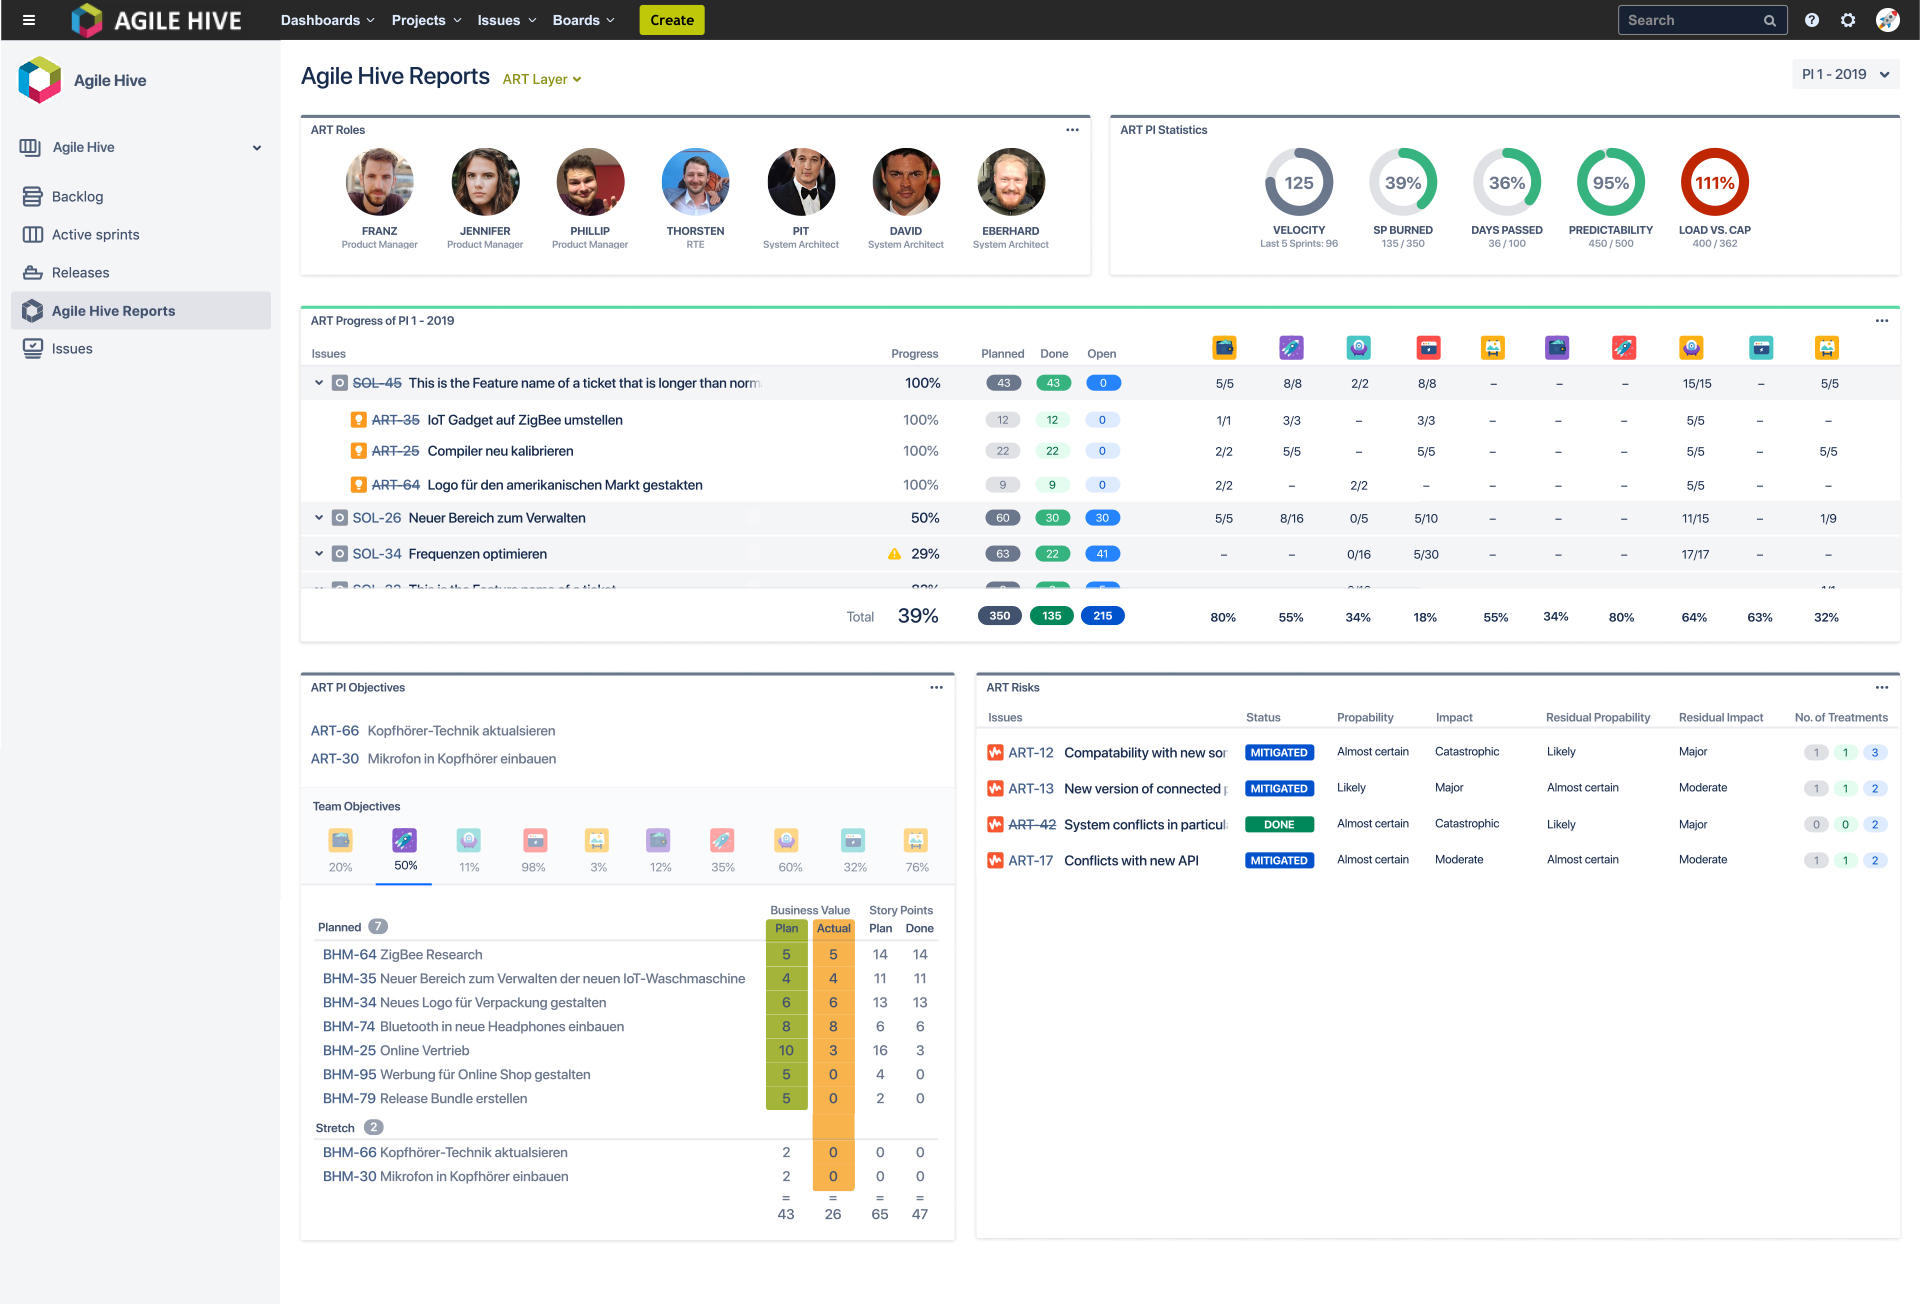
The program roles of an Agile Release Train (ART) are displayed together with their avatar, first name, and role.
ART Roles
This displays all program roles for an "Agile Release Train" (ART). Program roles are displayed along side the individual's avatar, their first name, and their role in order to identify a contact person more quickly.
ART PI Statistics
Here are five important (partly aggregated) key figures for viewing progress, performance, and planning at a glance:
-
-
- Velocity - Compares the current velocity of all teams (inside the circle) with the velocity of the last 5 sprints.
- SP Burned - Total progress across all burned Story Points (SP) of all teams within their PIs.
- Days Passed - Compares number of total days with days still available.
- Predictability - Average point total of all teams based on the business value from the teams' PI objectives.
- Load vs. Cap - Compares planned Story Points of all teams with available capacity.
-
ART Progress (included in first release)
This displays all planned program operations () including parent operations () within a PI. Progress within processes is displayed in detail, utilizing both percent and story points. Something worth noting is that all ART associated teams are represented here along with their participation in their respective program processes.
ART PI Objectives
"ART PI Objectives" are derived from the defined "Team PI Objectives". You can find them at the top of your dashboard. Below, all "Team PI Objectives" of existing teams can be viewed in a separate tab.
ART Risks
Here you'll find risk management according to ROAM (Resolved, Owned, Accepted, Mitigated), including listing all ART risks. Classification is based on probability and impact. "Treatments" are procedures where you deal with the respective risks. Along with their status, these treatments are displayed with each risk. Additionally, treatments have a direct effect on how likely something is to happen (residual probability) and impact (residual impact).
Find out more about Agile Hive https://agile-hive.com/


